


Summary:
In this project, I have Developed and implemented a data warehouse project utilizing dimensional modelling techniques. Used SAP retail business Database. Performed the ETL (Extract, Transform, and Load) database population process.
Links to Download Project:
Relational Database before transformation: - Link
Transformed Database: - Link
The fact table and Dimension Table:- Link
What is a data warehouse?
A data warehouse is the central repository of Information for your organization. Data warehouse helps organizations to support and manage business intelligent (BI) activities. Data flows into the Data warehouse from the organization's operational system.
Goals of Datawarehouse and Business Intelligence:
You can readily understand goals by Walking through the halls of the organization and listening to business management people. Some of the important goals are-
Easy accessibility of data that has been collected from various operational systems.
Information in the data warehouse must be understandable and readable.
Dataware houses must be secure and trustworthy.
Break down data in every way possible for example- sales on weekends, sales on weekdays, or maybe you want to break sales by every Saturday.
To make an informative decision Business people need to get at data easily.
For making more fact-based decisions.
“MOST DATA WAREHOUSE IS A CONSTANT ONGOING PROCESS - THE MAIN USERS OF DATA WAREHOUSE WILL BE BUSINESS PEOPLE.”
Datawarehouse Nuts and Bolts:
Now, let’s understand Dataware housing system goals. And, how data is being presented in Datawarehouse.
The best way to present analytical data is achieved using “Dimensional modelling” which is a widely accepted technique. Dimensional models implemented in Relational database systems are referred to as star schemas. And, star schemas are made up of Fact and Dimension Tables. And multi-dimensional database environments are referred to as online analytical processing(OLAP). OLAP cubes rely on indexing and other techniques to form relationships between facts and dimensions.
Fact Tables:- In fact tables, data should be presented at the lowest level possible to describe business processes or events. Events are facts, and looking at the fact table you can see the story of when, how, where, and who did it. Facts are semi-additive or non-additive.
Dimension Tables:- Facts tables have two or more foreign keys which are used to connect to dimension tables. Dimension tables contain textual context associated with business events that have been recorded in facts tables. Dimension tables will have fewer rows than the facts tables but almost way more attributes. And, finding the most possible attributes is key to Datawarehouse reporting as dimensional attributes are what are usually used for queries.
Data Warehouse Architecture:
Operational Source Systems:
These are the systems that provide data for the Data warehouse. These systems capture the day-to-day transaction data of an organization. And, Data warehouse designers have no control over these systems. Most of the time several systems can feed data into Datawarehouse. And, data coming from these systems oftentimes need to be adjusted or expended before being loaded into Datawarehouse.
ETL(Extract Transform Load) System:
It is the area where data coming from different source systems will often have different formats and names. So, with the help of ETL, we adjust the data.
Extract: It is a process of extracting necessary data coming from source systems. It takes attention to detail and must be completed by considering future goals. Extracting everything will increase the cost, and size and reduce performance so identifying and understanding necessary data would be very useful.
Transform: Data is transformed before it is loaded into the Data warehouse. Transformations can take various forms depending on business requirements. But the most basic level transformation includes correcting misspellings, parsing data into standard formats, changing variable names, etc. During transformation, we also need to consider the way to deal with data duplications.
Load: In this stage, data is introduced or loaded into DW systems. The key task of linking facts and dimension tables must be created.
Data presentation Area:
After data is loaded in the ETL process it remains in the presentation area. This all BI users to see or get access to the Data warehouse. Everything else is behind the scenes for the BI users. At this stage, data is been loaded into the dimensional format and can be accessed for queries and reports.
Business Intelligence Applications
It is an application that is used by Data Warehouse end-user to present the Data Warehouse data easily and understandably. It can be from simple query writing applications to complex data visualization tools.
Building Dataware House:
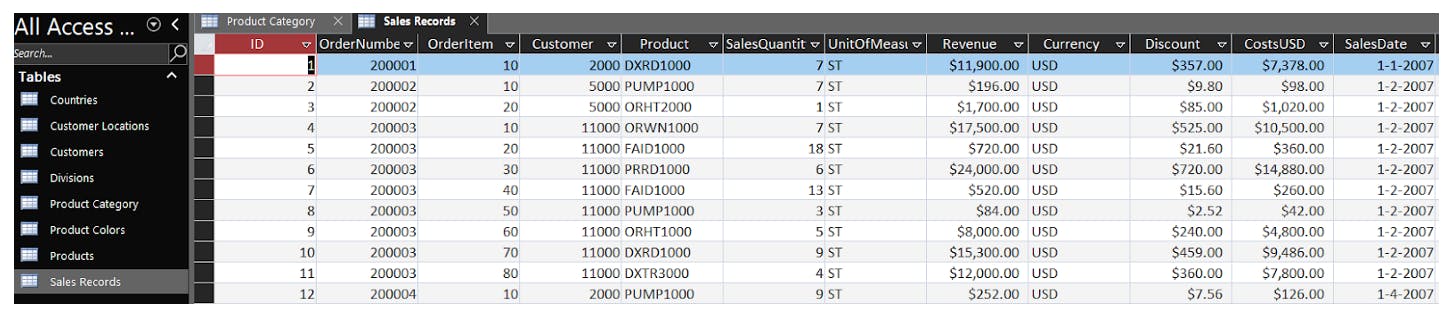
For Building we have taken SAP Relational Database for the Bike sales. Database from Operational Source System which contains different data and information.
Access the database here:- SAP Database
ETL(Extract, Transform, Load) System:
Extracting data- Extracted data from a relational database.
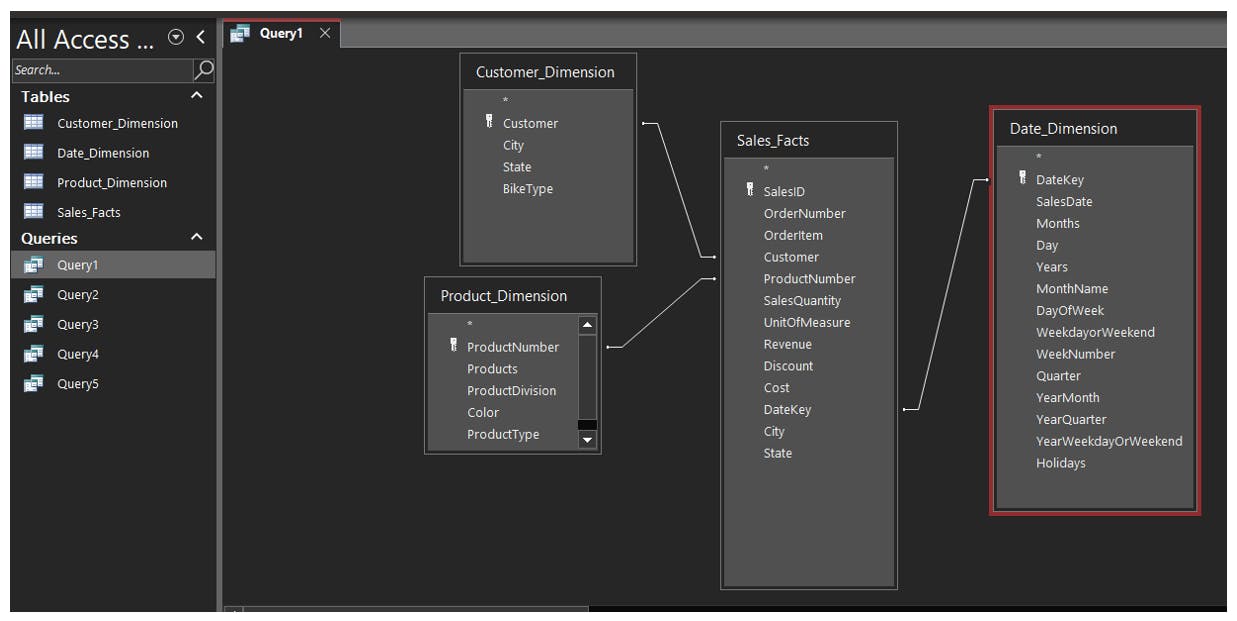
Transform - Formed relationship, cleaned the data, and transformed data into dimensional modeling.
For Dimensional modeling, we need a Sales facts table and a dimension table. Based on the database I have created one sales facts table, Date dimension table, customer dimension table, and Product Dimension table to give end users a better way to form relationships and filter queries based on the business requirement.
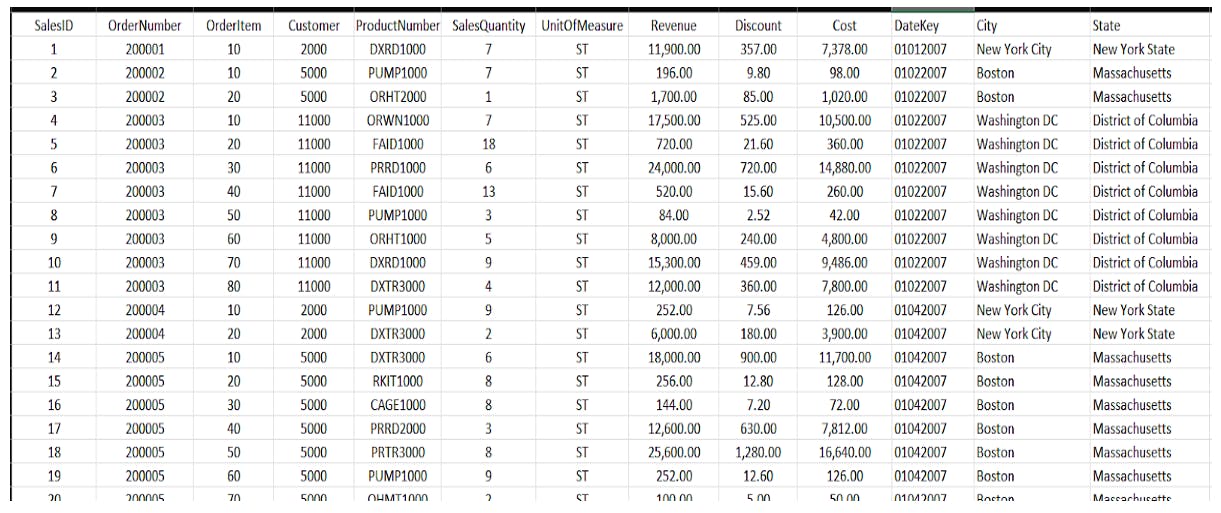
Load- After transformation, we loaded data into MS Access and formed relationships between tables for query and getting helpful insight from our transformed data.
Dimension Table components:
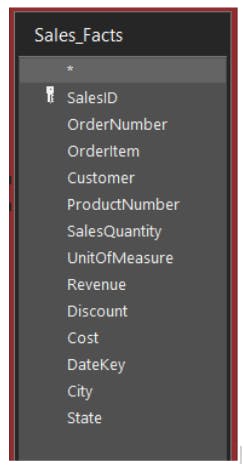
Sales Fact Table:
A fact table is presenting it to the lowest grain possible. We have selected SalesID as our primary key.
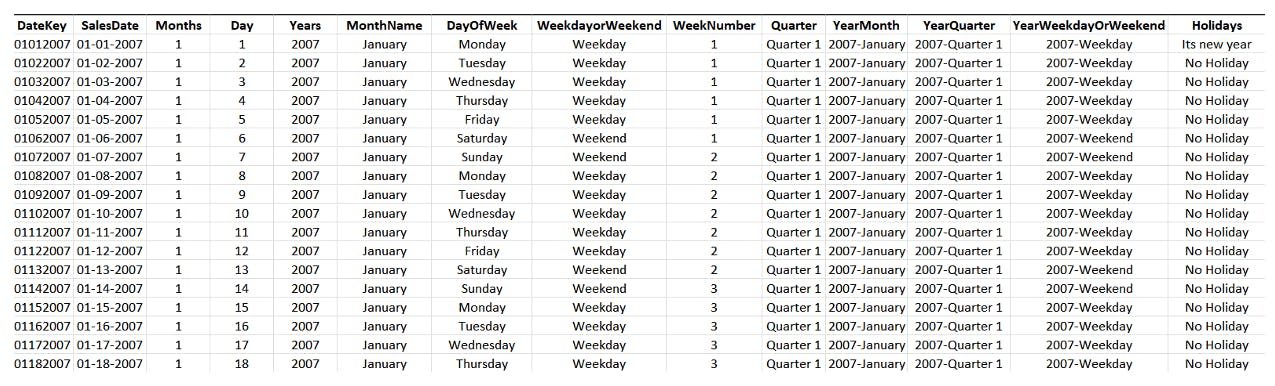
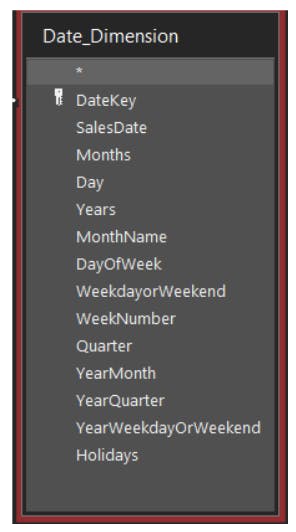
Date Dimension:
We have broken down dates between 2009 to 2017 in every possible way including holidays.
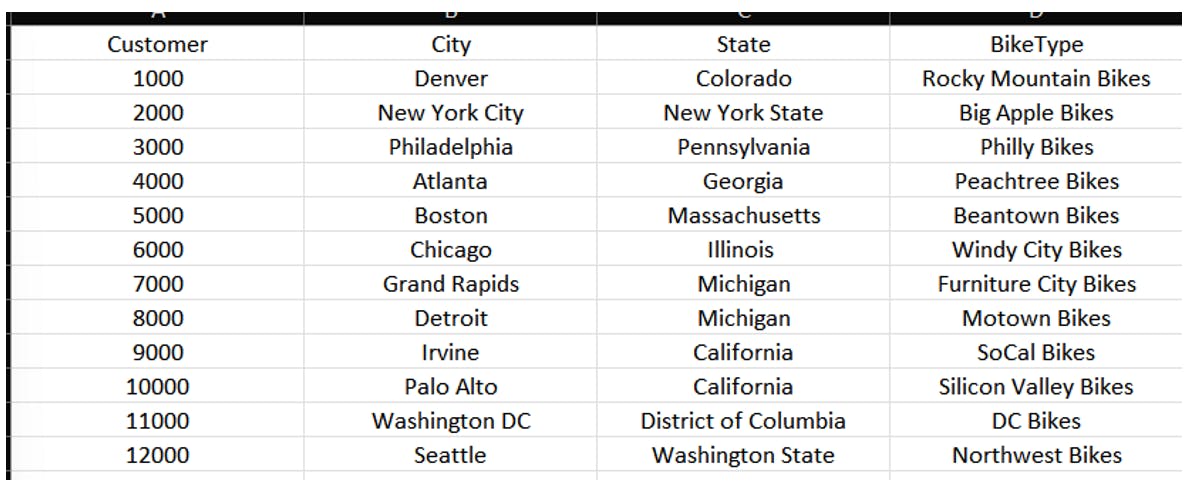
Customer Dimension:
We have included all textual context for the customer in the customer dimension. We have taken the customer ID and based on it we have included the city, state, and bike type they ordered.

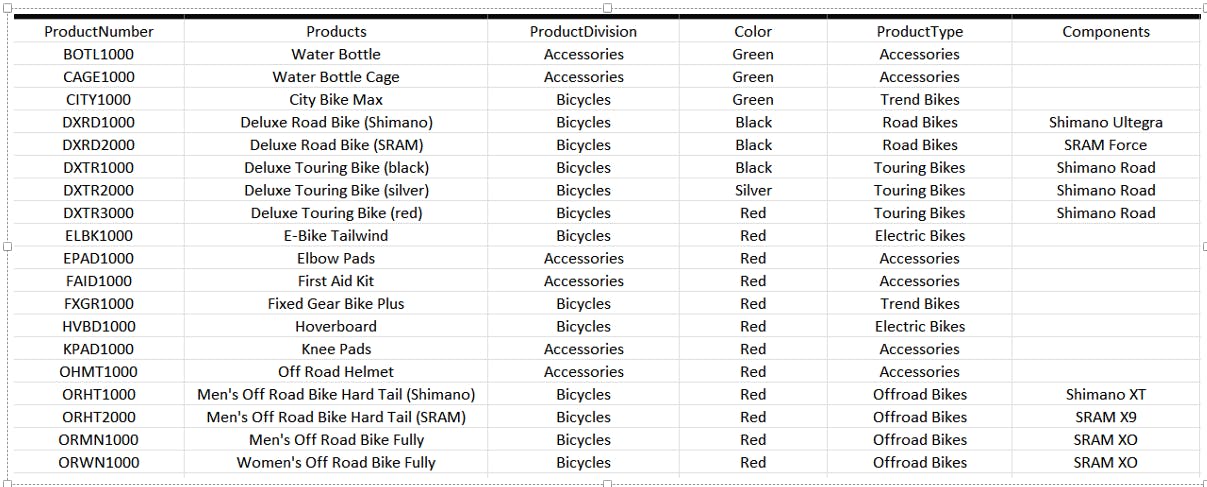
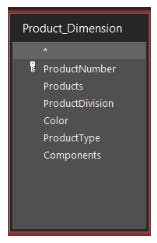
Product DImension:
Product dimension consists of the product number, color, product type, and other relevant information.
Queries Created:
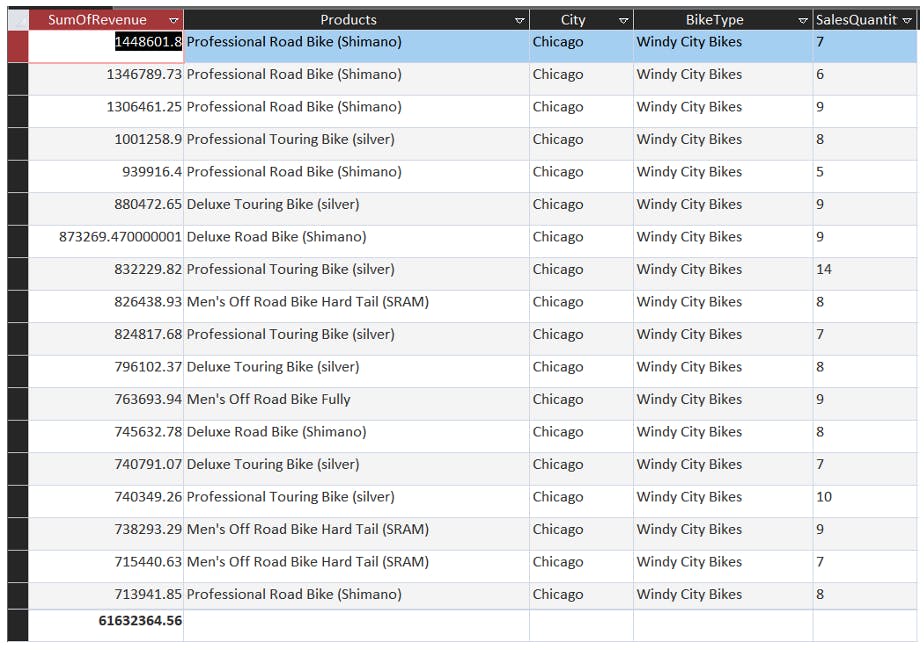
I wanted to see the sum of revenue for each type of bike sold in Chicago with the no of quantities sold.
I wanted to see how many bicycles are sold in 2016, to different customers, with the colour Black.

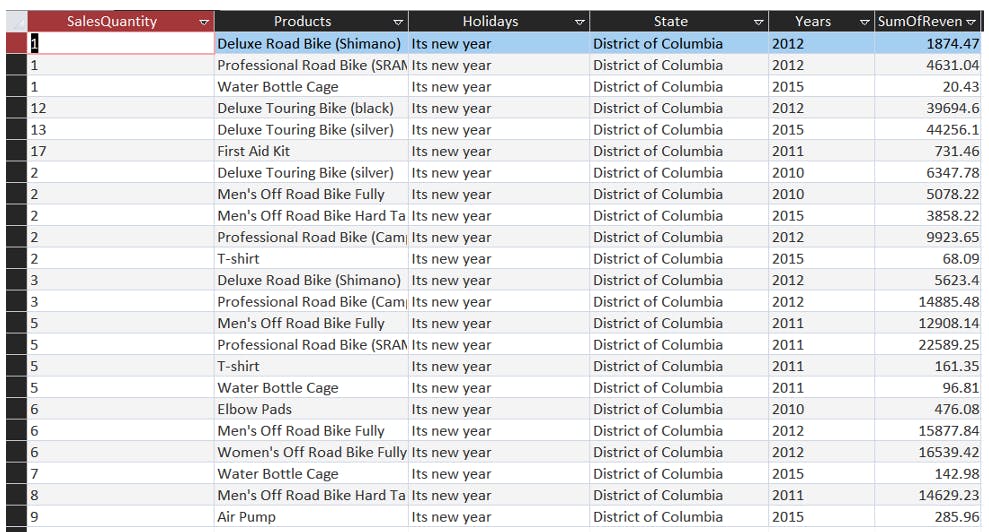
I wanted to find out how much revenue the state of “The District of Columbia” generates every year on the New Year Holiday from a different line of products that have been sold.
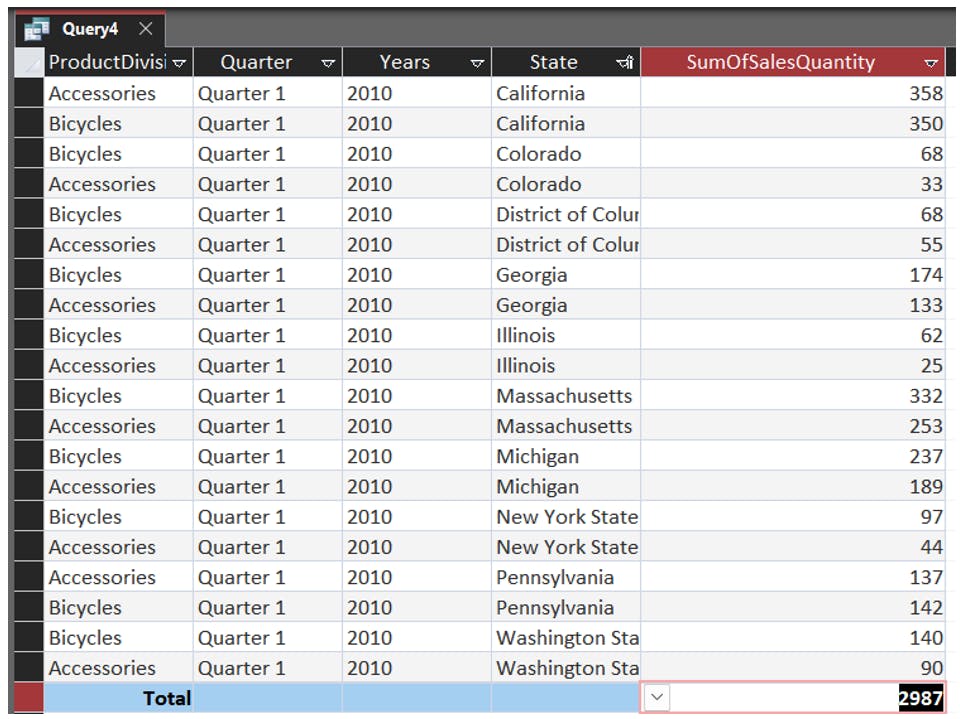
I wanted to find out about Accessories and Bicycles sold in Quarter 1 of the year 2010, and the revenue generated by each state.
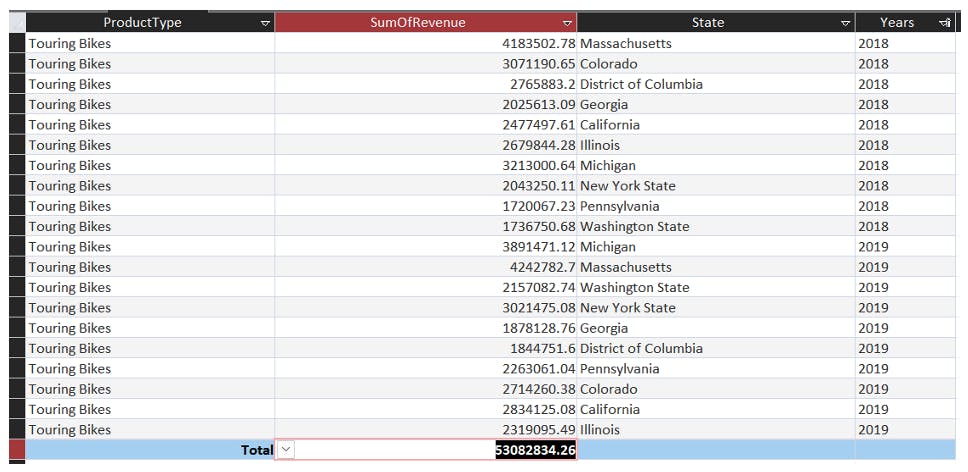
Our organization planning to acquire a profitable and affordable “touring bikes” manufacturer company. But before we can make a decision we want to get factual numbers for our sales that come out from Touring Bikes sales in each state and overall. Specifically in the last two years 2018 and 2019.
Conclusion:
Data warehousing is a very powerful way to generate facts-based decisions for Businesses. But, the most important consideration when any enterprise or organization wants to create a data warehouse- is justification for the projects, preliminary scope (it will change based on need), and identification of resources. A successful Data Warehouse is very complex and needs everyone's involvement from business people, to technical people and Senior Business leads. A data warehouse is and will be an ongoing process based on business needs. Detailed planning and collecting business requirements are important before we can decide whether we need Data Warehouse or not.