Observability Guide: Real-Time Monitoring with Prometheus, Grafana for EKS Cluster.


Table of contents
Summary:
In this article, you will delve into the world of observability and explore its benefits and implementation. You'll discover what observability is and how it works, and learn about the different observability tools available in the market.
Furthermore, you will get a step-by-step guide on how to deploy real-time monitoring for an EKS (Elastic Kubernetes Service) Cluster with Prometheus and Grafana Dashboard using Helm. This will enable you to monitor and visualize the performance of your EKS cluster in real-time, allowing you to identify and resolve issues quickly.
What is Observability?
"Ability to gain insights into the internal state and behaviour of a system or application from its external outputs and events. In other words, it refers to the extent to which you can observe and understand what is happening inside a system by looking at its external signals. Like your car dashboard where you get input from all the different activities within the car."
How does it work?
Observability captures telemetry data that can be used to gain insight and understand how your system is behaving. And, based on the insight you create a plan and make changes.
Telemetry data includes four main pillars M(Metric), E(Events), L(Logs), T(Traces):
Metric: It is refer to measurements of system performance, such as CPU usage, memory utilization, network latency, and response time. Metrics are often collected over time and used to gain insights into the health and behavior of a system
Events: It is discrete occurrences in the system that can be logged and analyzed. Events can include things like user actions, system failures, and other notable incidents.
Logs: Logs are records of events and activities that have occurred within a system or application. Such as error messages, warnings, and other system information
Traces: These represent all of the things an application transaction spent its time on – all ordered over time from beginning to end.
Why should we use it?
Observability can help businesses to define SLO(Service Level Objective), SLO in simple terms- "contract between a service provider and consumer".
Observability telemetry data can be used to monitor SLI(Service Level Indicators) that measure the actual performance of your system and in order to meet SLO your SLI should meet or exceed the performance.
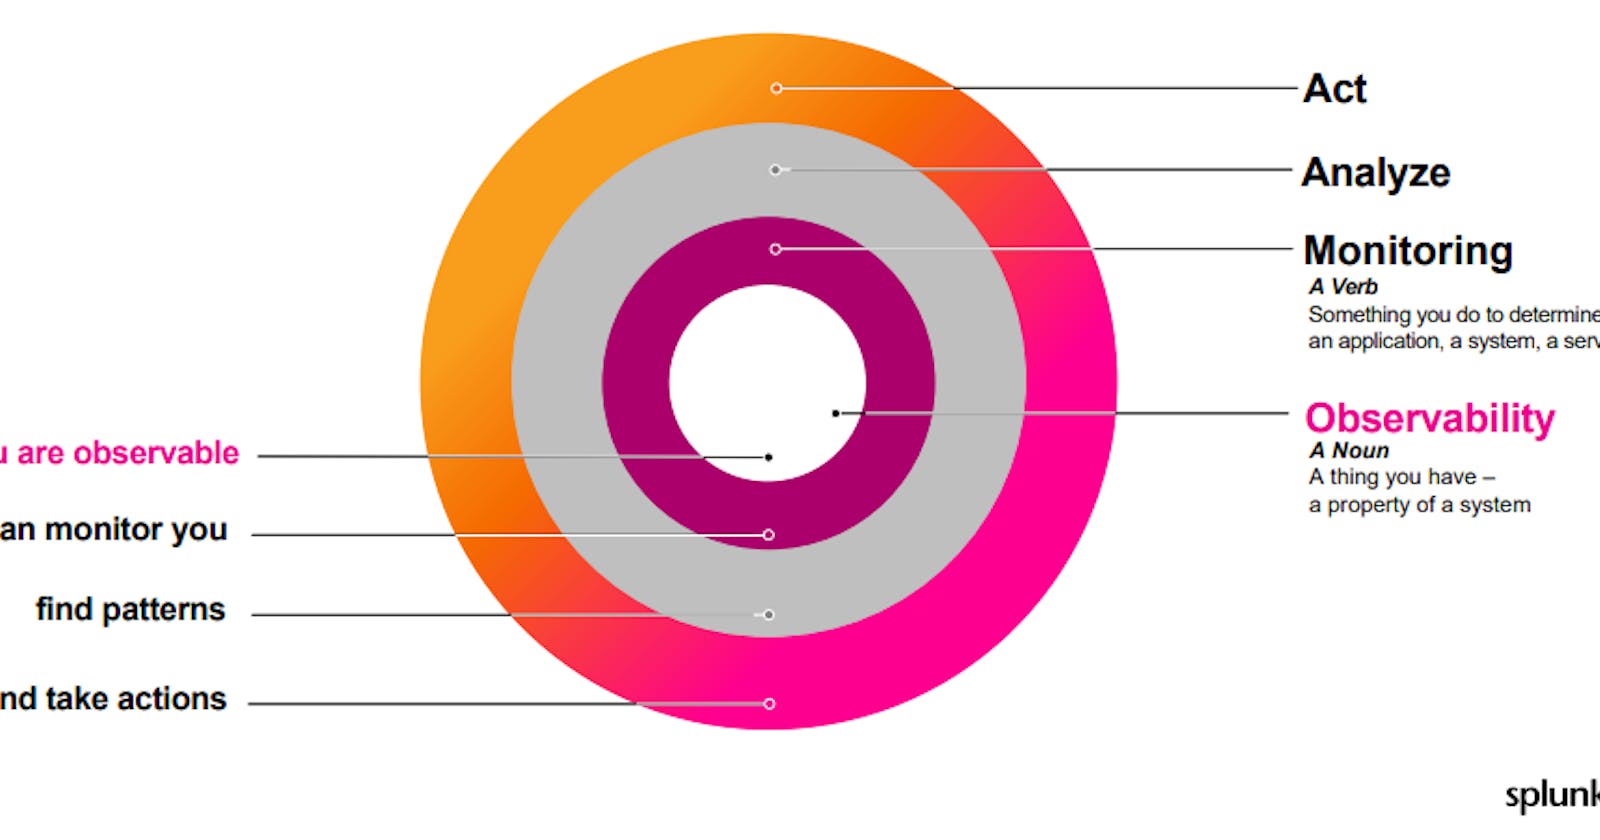
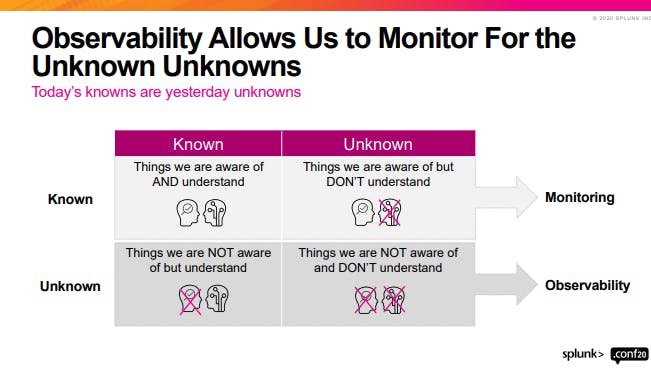
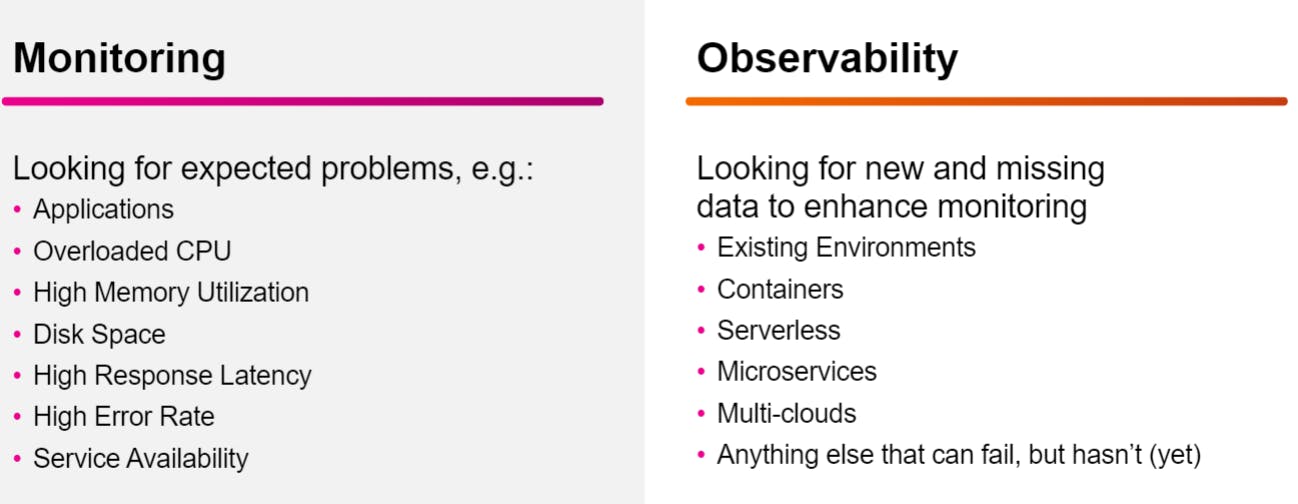
The major difference between Monitoring and Observability according to Splunk:
Tools that are used for observability:
Splunk: Splunk is a software platform that allows organizations to collect, analyze, and visualize machine-generated data in real-time.
Opentelemetry: It is a tool that uses vendor-natural open-source tools, API, and SDK. It can be used with a variety of programming languages. And, it provides a consistent format for generating, gathering, and exporting application telemetry data such as metrics, logs, and traces.
Prometheus: It is an open-source monitoring and alerting system that collects and stores time-series data from various sources and provides a query language and alerting mechanisms for data analysis.
Grafana: Grafana is an open-source visualization and analytics software that allows users to create, explore, and share dashboards and panels to visualize time-series data from various sources, including Prometheus, InfluxDB, Elasticsearch, and more.
ElasticSearch: Elasticsearch is an open-source search and analytics engine that allows users to store, search, and analyze large volumes of structured and unstructured data in real-time. It is commonly used for log analysis, full-text search, and business analytics.
CloudWatch: Amazon CloudWatch is a monitoring and observability service provided by Amazon Web Services (AWS) that allows users to collect and track metrics, collect and monitor log files, and set alarms.
Cloud trail: AWS CloudTrail is a service provided by Amazon Web Services (AWS) that enables governance, compliance, operational auditing, and risk auditing of an AWS account. It provides a record of all AWS API calls made by users and services within the account, including details such as the identity of the caller, the time of the call, the parameters passed, and the response returned.
X-ray: It is an aws service it provides a way to trace requests through complex application architectures, and identify bottlenecks, errors, and latency issues. X-Ray provides a visual representation of the components and services involved in a request, and provides detailed information about each component's performance, including response times, errors, and fault rates.
Maximizing Observability and Visualization Capabilities of AWS EKS Cluster with Prometheus and Grafana Integration
Grafana:
Grafana is a visualization tool that allows users to create customized dashboards for monitoring and visualization of time-series data from various sources. It provides a unified view of data from multiple endpoints, including Prometheus, databases, APIs, and more. The data can be presented in various formats such as tables, graphs, and other visualizations.
Grafana allows users to create multiple dashboards for different endpoints, allowing them to monitor and troubleshoot multiple systems from a single platform.
It supports collaborative efforts by allowing teams to work on the same dashboard, and share their work with others. Grafana was designed to democratize data access across organizations, making data more accessible to everyone and not just limited to a single operations person or team.
Prometheus:
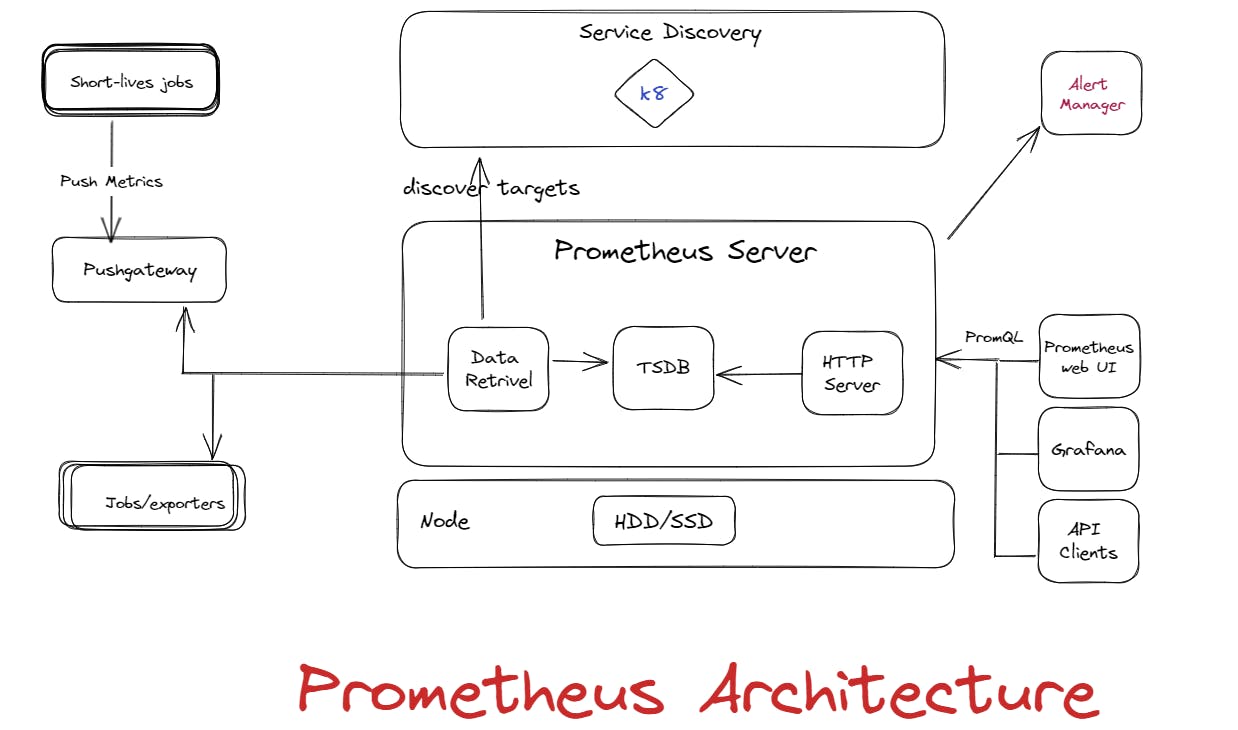
It is an instrumentation tool or scrapping tool that sits on top of data and pulls the data from various sources and stores it that can be used with various visualization tools such as Grafana.
Major components:
Prometheus server: Main application server that sends alerts, and collects, and store metrics. Inside of Prometheus server, we will have three major sub-components:
Time-Series Database(TSDB): To store metric data such as current CPU usage.
Retrieval: Responsible for pulling metrics data from applications, servers, or services and pushing it into the database.
HTTP server: It accepts queries for stored data.
Push Gateway: Push Gateway is useful for monitoring metrics from jobs that are not instrumented with Prometheus client libraries or have short lifetimes.
Exporters: It is like agents that help Prometheus to get data from different APIs, databases, and infrastructures. It sits between your app and Grafana.
Alert manager: It sits between the Prometheus server and receiving endpoints like email.
How does Prometheus know what data to scrap and when?
During deployment, we can define a configuration in Prometheus.yml that will have details about how, what, and which values you want to scrape from its target.
Hands-On:
Pre-requisite:
intermediate understanding of AWS
intermediate understanding of git
Troubleshooting ability
intermediate CLI experience
In this section, we will be implementing EKS Cluster, Grafana, and Prometheus using Helm and bash scripting.
The flow of execution:
Create EC2 Instance
Attach IAM role to it having full access
Install and setup AWS CLI, Kubectl, Helm chart
Create Amazon EKS cluster using eksctl
Install Kubernetes metrics server
Download the Prometheus repository using the helm
Update helm chart repository
Create Prometheus namespace
Install Prometheus server
Create IAM OpenID Connect for service accounts.
Create an IAM service account with a role
Attach role to EKS cluster
Download Grafana
Create Prometheus data source for Grafana to access Kubernetes metrics
Create namespace grafana
Install Grafana
run kubectl get service -n grafana
copy external IP and paste it into your browser
Login to the dashboard using the username - admin, password EKS!sAWSome
Import Grafana Dashboard and visualize your metrics
clean up
I have divided the flow of execution into 5 stages.
Stage 1:
Create EC2 Instance
Attach IAM role to it having full access
Open access to any port for your ipv4 in your security group
Stage 2:
Open AWS Command Line for your created instance and run the below command one by one whole process can take anywhere around 20 to 30mins:
apt install git
### I HAVE WRITTEN WHOLE STEPS IN THE BASH SCRIPT FOR EASY EXECUTION AND DEPLOYMENT OF RESOURCES. HOWEVER YOU CAN CHANGE INSTANCE TYPE AND REQUIREMENT BASED ON YOUR NEED IN PART2.

git clone https://github.com/Nayanshivhare/Grafana-Prometheus-EKS-setup.git

cd Grafana-Prometheus-EKS-setup/
ls
chmod 700 Part1-Tools.sh Part2-Cluster.sh Part-3Monitoring.sh
Stage 3:
Now run downloaded bash scripts for deploying all the necessary resources for our project.
Part 1 contains all the necessary tools.
Part 2 contains cluster setup.
Part 3 contains monitoring tools installation.
You can only make changes in the EKS Cluster configuration, for part 2. Besides that, it is recommended not to make any changes.
IF YOU DON'T WANT TO MAKE ANY CHANGES RUN THE BELOW COMMANDS TO GET STARTED WITH DEPLOYMENT.
# Run
./Part1-Tools.sh
# Wait for it to complete.
# Now run part 2
./Part2-Cluster.sh

#once it is completed run part 3
./Part-3Monitoring.sh
###################################################
###### Your installation is completed. ##########

## Get external ip address
kubectl get service -n grafana
Stage 4:
Copy the external IP and paste it into the browser and enter username and password.
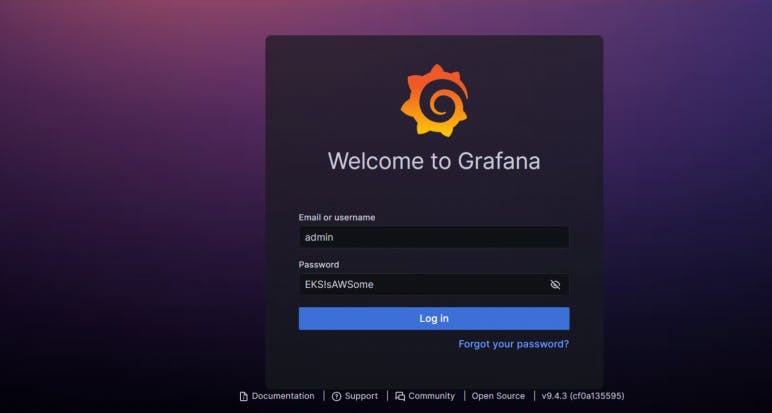
Username- admin
Password- EKS!sAWSome
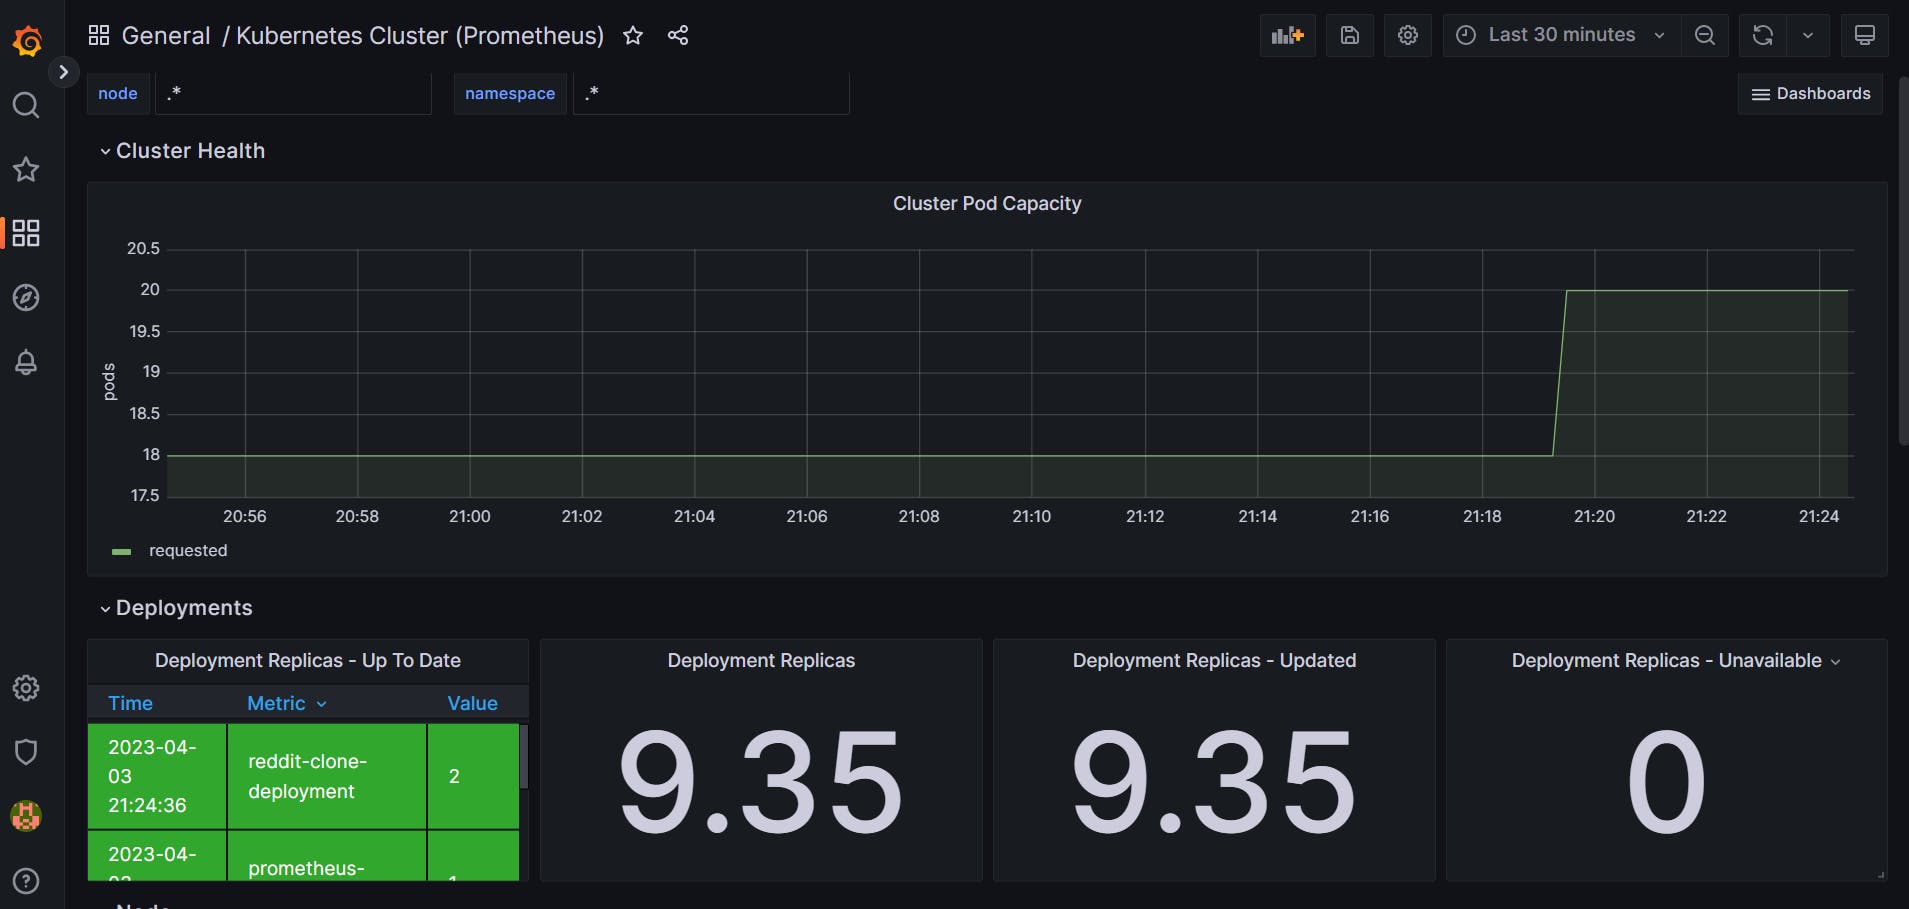
Import Grafana Dashboard:
Click on four squares, click on import dashboard
enter 6417, and load.
From the Prometheus option select Prometheus.
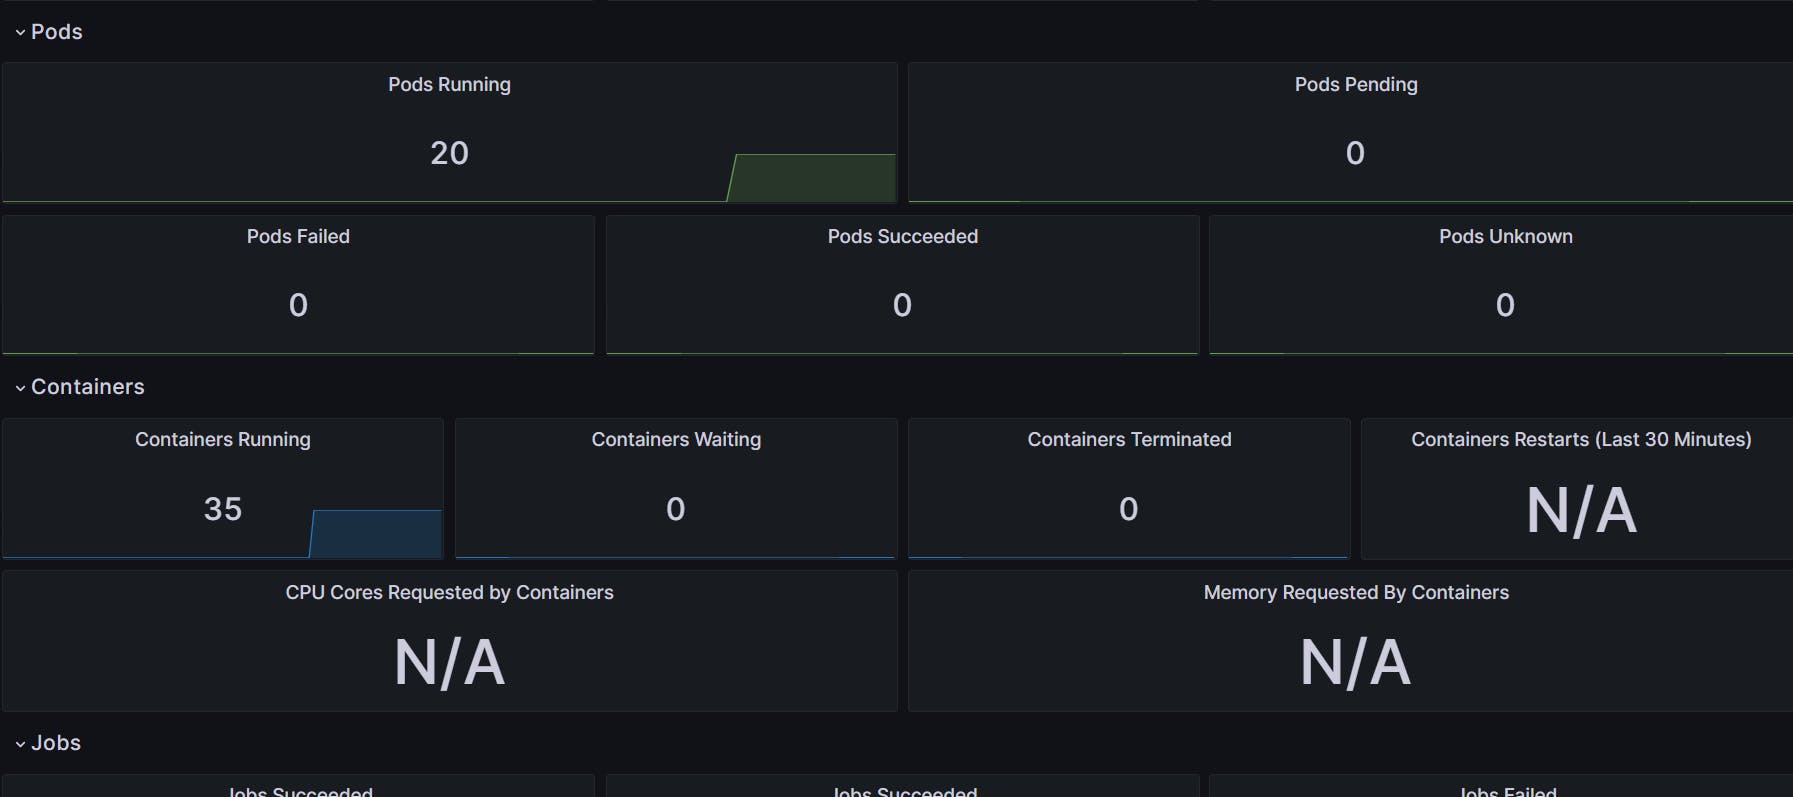
You have your dashboard running.
Stage 5:
clean up
eksctl delete cluster --name eks-cluster --region us-east-2